Market Outlook
July14, 2017
Market Cues
Domestic Indices
Chg (%)
(Pts)
(Close)
Indian markets are likely to open on Positive note tracking SGX Nifty and global
BSE Sensex
0.7
233
32,037
indices.
Nifty
0.8
76
9,892
U.S. Stocks turned in a relatively lackluster performance during trading on Thursday
Mid Cap
0.5
69
15,154
but managed to end the day modestly higher. With the uptick on the day, the Dow
Small Cap
0.4
167
15,964
reached another new record closing high. Traders seemed reluctant to make more
Bankex
0.9
244
27,047
significant moves ahead of the release of some key economic data and earnings
news on Friday. The major averages posted slim gains on the day. The Dow crept
up 0.1 percent to 21,553, the Nasdaq rose 0.2 percent to 6,274 and the S&P 500
Global Indices
Chg (%)
(Pts)
(Close)
edged up 0.2 percent to 2,447.
Dow Jones
0.1
121
21,553
U.K. stocks ended marginally lower on Thursday, with a strong pound and losses for
Nasdaq
0.2
13
6,274
drugmaker AstraZeneca PLC weighing on the London blue-chip benchmark, a day
FTSE
(0.0)
(3)
7,413
after it logged its biggest gain in more than two months. The FTSE 100 UKX, ended
Nikkei
(00.0
( 1
20,100
down 0.1% at 7,413, after closing at its highest level since June 27 on Wednesday
Hang Seng
1.2
303
26,346
Domestic front, Sensex and the Nifty hit record closing high. The Sensex settled
Shanghai Com
0.6
21
3,218
above the 32,000 level. Market sentiment had also got a boosted from record low
inflation data which creates hope for further rate cut by RBI. The senses rose 0.7% to
Advances / Declines
BSE
NSE
close at 32038. The Nifty indexed gained 0.77% to settle at 9892.
Advances
1,295
1,846
News Analysis
Declines
1,458
846
TCS (CMP: `2,493/ TP: `2,651/Upside: 8.7%)
Unchanged
152
71
Infosys (CMP: `976 / TP: `1,179/Upside: 20.8%)
Volumes (` Cr)
Detailed analysis is on Pg2
BSE
4,341
Investor’s Ready Reckoner
NSE
28,366
Key Domestic & Global Indicators
Stock Watch: Latest investment recommendations on 150+ stocks
#Net Inflows (` Cr)
Net
Mtd
Ytd
Refer Pg6 onwards
FII
(56547
(2(874)
55,034
MFs
8322
3,488
42,634
Top Picks
CMP
Target
Upside
Company
Sector
Rating
(`)
(`)
(%)
Top Gainers
Price (`)
Chg (%)
Blue Star
Capital Goods
Buy
640
760
18.7
Sintexem
134
15.8
Dewan Housing FinanceFinancials
Buy
443
520
17.4
Mahindra Lifespace
Real Estate
Buy
446
522
17.0
Network18
58
11.8
Navkar Corporation
Others
Buy
206
265
28.6
Tv18Brdcst
41
7.9
KEI Industries
Capital Goods
Accumulate
237
258
8.9
Nationalum
73
7.2
More Top Picks on Pg3
Kec
295
6.3
Key Upcoming Events
Previous
Consensus
Date
Region
Event Description
Reading
Expectations
Top Losers
Price (`)
Chg (%)
Jul 14, 2017
China
Exports YoY%
11.30
8.90
Gvkpil
247
(4.3)
Jul14, 2017
India
Exports YoY%
8.30
Prestige
274
(3.2)
Jul 14, 2017
India
Monthly Wholesale Prices YoY%
2.17
1.39
Shriramcit
2,230
(3.2)
Jul 14, 2017
US
Industrial Production
-
0.30
Ioc
381
(3.0)
Jul 14, 2017
US
Consumer price index (mom)
(0.10)
0.10
More Events on Pg4
Hexaware
246
(2.8)
#as on 13t July, 2017
Market Outlook
July14, 2017
News Analysis
TCS (CMP: `2,493/ TP: `2,651/Upside: 8.7%)
TCS, results were below expectations on the EBIT and net profit front. The company
posted 3.1% sequential growth in USD revenues to US$4,591mn V/s US$4,585mn
expected, mostly volume lead (3.5%). On Constant Currency terms, the company
posted a 2.0% qoq growth. In rupee terms, revenues are expected to come in at
`29,548cr V/s `29,600cr expected, down 0.2%. qoq.
In terms, of geography Latin America and Continental Europe posted a qoq
growth of 2.8% and 5.9% respectively. Its key market USA posted a qoq growth of
1.7%. India and Asia Pacific posted a qoq growth of 1.5% and 1.2% respectively.
On profitability, the EBIT margins, came in at 23.4% V/s 24.2% expected, posting
a qoq dip of 233bps qoq. Impact of wage hikes and visa expenses, apart from
rupee appreciation was the major drag for profitability. Consequently, PAT came
in at `5,940 V/s `6,275cr expected, de-growth of 10.1% qoq.
In terms of order inflows, clients of $100M+ were up by 1, $50M+ were up by 1,
$10M+ were up by 12. On operational front, the LTM attrition at 11.6% in IT
Services. We maintain our accumulate rating on the stock with a target price of
`2,651.
Y/E
Sales OPM
PAT
EPS ROE P/E P/BV EV/EBITDA EV/Sales
March
(` cr)
(%)
(` cr)
(`)
(%)
(x)
(x)
(x)
(x)
FY2018E
1,27,403
27.6
28,272
144.5
29.7
16.9
5.0
12.1
3.3
FY2019E
1,38,870
27.6
30,524
156.0
29.8
15.7
4.7
10.9
3.0
Infosys (CMP: `976 / TP: `1,179/Upside: 20.8%)
Infosys is slated to announce its 1QFY2018 results today. We expect the company
to post 2.6% sequential growth in USD revenues to US$2,657mn, mostly volume
lead. In rupee terms, revenues are expected to come in at `17,131cr, up 0.1%.
qoq. EBIT margin is expected to show decline of ~104bp qoq to end at 23.6%.
Impact of wage hikes and visa expenses, apart from rupee appreciation is
expected to be the major drag for profitability. Consequently, PAT is expected to be
at `3,443cr, de-growth of 4.4% qoq. We maintain our buy rating on the stock with
a target price of `1,179.
Y/E
Sales OPM
PAT
EPS ROE P/E P/BV EV/EBITDA EV/Sales
March
(` cr)
(%)
(` cr)
(`)
(%)
(x)
(x)
(x)
(x)
FY2018E
73,963
26.0
14,785
64.4
19.7
15.2
3.0
9.5
2.5
FY2019E
80,619
26.0
15,916
69.3
19.6
14.1
2.8
8.5
2.2
Market Outlook
July14, 2017
Economic and Political News
With FIPB scrapped, PM to hold review meeting of FDI policy today
I-T lens on half a million people for 'inconsistencies' in cash deposits
Corporate News
U.S. FDA advisory committee favours nod for Biocon’s proposed biosimilar
GVK Power sells residual 10 percent stake in Bengaluru Airport
Pricol to acquire 100 percent stake in PMP Auto Components
NMDC: Iron ore production at 8.52 million tonne during April-June period.
Book Profit- AU Small Finance Bank Ltd.
The IPO of AU Small Finance Bank Ltd got strong response from investor’s
community and listed at a hefty premium to its issue price. It was among the ten
NBFC which got the licenses to start operations as a small finance bank. Before
migrating as a SFB , as an NBFC the company had focused on lending to assets
with revenue generating ability. As an NBFC it had successfully operated and grew
its AUM by 30% CAGR over FY13-17 and it’s PAT by 47%. With focus on Vehicle
Finance -50%, MSME-30% and SME -20% of the portfolio, AU has not only
withstood completion from large NBFC, but also thrived. While from all
parameters the company has delivered, the sharp surge in the stock price post
listing makes it quite expensive compared to other listed NBFCs/ Banks/ SFBs. At
the closing price of Rs 691 the stock is trading at 9.8x its FY17 BV. Even if it is able
to grow at 30% CAGR over FY17-20, the valuations still comes at 5.5x its FY17BV
based on our quick estimates. Looking at the sharp surge in the stock post listing
and the expensive valuations we recommend booking profit in the stock.
Market Outlook
July14, 2017
Top Picks ★★★★★
Market Cap
CMP
Target
Upside
Company
Rationale
(` Cr)
(`)
(`)
(%)
Strong growth in domestic business due to its leadership
in acute therapeutic segment. Alkem expects to launch
Alkem Laboratories
21,609
1,807
2,161
19.6
more products in USA, which bodes for its international
business.
We expect the company would report strong profitability
Asian Granito
1,345
447
480
7.3
owing to better product mix, higher B2C sales and
amalgamation synergy.
Favourable outlook for the AC industry to augur well for
Cooling products business which is out pacing the market
Blue Star
6,123
640
760
18.7
growth. EMPPAC division's profitability to improve once
operating environment turns around.
With a focus on the low and medium income (LMI)
consumer segment, the company has increased its
Dewan Housing Finance
13,890
443
520
17.4
presence in tier-II & III cities where the growth opportunity
is immense.
Loan growth is likely to pick up after a sluggish FY17.
Karur Vysya Bank
8,527
141
160
13.4
Lower credit cost will help in strong bottomline growth.
Increasing share of CASA will help in NIM improvement.
High order book execution in EPC segment, rising B2C
KEI Industries
1,843
237
258
8.9
sales and higher exports to boost the revenues and
profitability
Speedier execution and speedier sales, strong revenue
Mahindra Lifespace
2,290
446
522
17.0
visibilty in short-to-long run, attractive valuations
Massive capacity expansion along with rail advantage at
Navkar Corporation
2,938
206
265
28.6
ICD as well CFS augurs well for the company
Strong brands and distribution network would boost
Siyaram Silk Mills
2,276
2,428
2500
3.0
growth going ahead. Stock currently trades at an
inexpensive valuation.
Market leadership in Hindi news genre and no.
2
viewership ranking in English news genre, exit from the
TV Today Network
1,479
248
344
38.8
radio business, and anticipated growth in ad spends by
corporates to benefit the stock.
After GST, the company is expected to see higher
volumes along with improving product mix. The Gujarat
Maruti
2,28,561
7,566
8,495
12.3
plant will also enable higher operating leverage which
will be margin accretive.
Source: Company, Angel Research,
Market Outlook
July14, 2017
Quarterly Bloomberg Brokers Consensus Estimate
Infosys Ltd Consol - July 14, 2017
Particulars ( ` cr)
1QFY18E
1QFY17
y-o-y (%)
4QFY17
q-o-q (%)
Net sales
16,998
16,782
1.3
17,120
(0.7)
EBITDA
4,463
4,447
0.3
4,658
(4.2)
EBITDA margin (%)
26.3
26.5
27.2
Net profit
3,429
3,436
(0.2)
3,603
(4.8)
ACC Ltd - July 17, 2017
Particulars ( ` cr)
2QCY17E
2QCY16
y-o-y (%)
1QCY17
q-o-q (%)
Net sales
3,263
2,870
13.7
3,557
(8.3)
EBITDA
454
457
(0.6)
416
9.1
EBITDA margin (%)
13.9
15.9
11.7
Net profit
246
238
3.5
212
16.4
Ultratech Cement Ltd - July 18, 2017
Particulars ( ` cr)
1QFY18E
1QFY17
y-o-y (%)
4QFY17
q-o-q (%)
Net sales
6,784
6,182
9.7
6,595
2.9
EBITDA
1,453
1,423
2.1
1,278
13.7
EBITDA margin (%)
21.4
23.0
19.4
Net profit
785
775
1.2
688
14.0
Market Outlook
July 14, 2017
Key Upcoming Events
Global economic events release calendar
Bloomberg Data
Date
Time
Country
Event Description
Unit
Period
Last Reported
Estimated
Jul 14, 2017
8:50 AMChina
Exports YoY%
% Change
Jun
11.30
8.90
India
Exports YoY%
% Change
Jun
8.30
12:00 PMIndia
Monthly Wholesale Prices YoY%
% Change
Jun
2.17
1.39
6:45 PMUS
Industrial Production
%
Jun
-
0.30
6:00 PMUS
Consumer price index (mom)
% Change
Jun
(0.10)
0.10
Jul 17, 2017
7:30 AMChina
Industrial Production (YoY)
% Change
Jun
6.50
6.50
7:30 AMChina
Real GDP (YoY)
% Change
2Q
6.90
6.80
Jul 18, 2017
2:30 PMEuro Zone
Euro-Zone CPI (YoY)
%
Jun F
1.30
2:00 PMUK
CPI (YoY)
% Change
Jun
2.90
2.90
Jul 19, 2017
6:00 PMUS
Housing Starts
Thousands
Jun
1,092.00
1,160.00
6:00 PMUS
Building permits
Thousands
Jun
1,168.00
1,210.00
Jul 20, 2017
7:30 PMEuro Zone
Euro-Zone Consumer Confidence
Value
Jul A
(1.30)
5:15 PMEuro Zone
ECB announces interest rates
%
Jul 20
-
Jul 24, 2017
1:00 PMGermany
PMI Services
Value
Jul P
54.00
7:30 PMUS
Existing home sales
Million
Jun
5.62
5.65
1:00 PMGermany
PMI Manufacturing
Value
Jul P
59.60
Jul 25, 2017
7:30 PMUS
Consumer Confidence
S.A./ 1985=100
Jul
118.90
118.00
Jul 26, 2017
2:00 PMUK
GDP (YoY)
% Change
2Q A
2.00
7:30 PMUS
New home sales
Thousands
Jun
610.00
615.00
11:30 PMUS
FOMC rate decision
%
Jul 26
1.25
1.25
Jul 28, 2017
6:00 PMUS
GDP Qoq (Annualised)
% Change
2Q A
1.40
2.50
Source: Bloomberg, Angel Research
Market Outlook
July 14, 2017
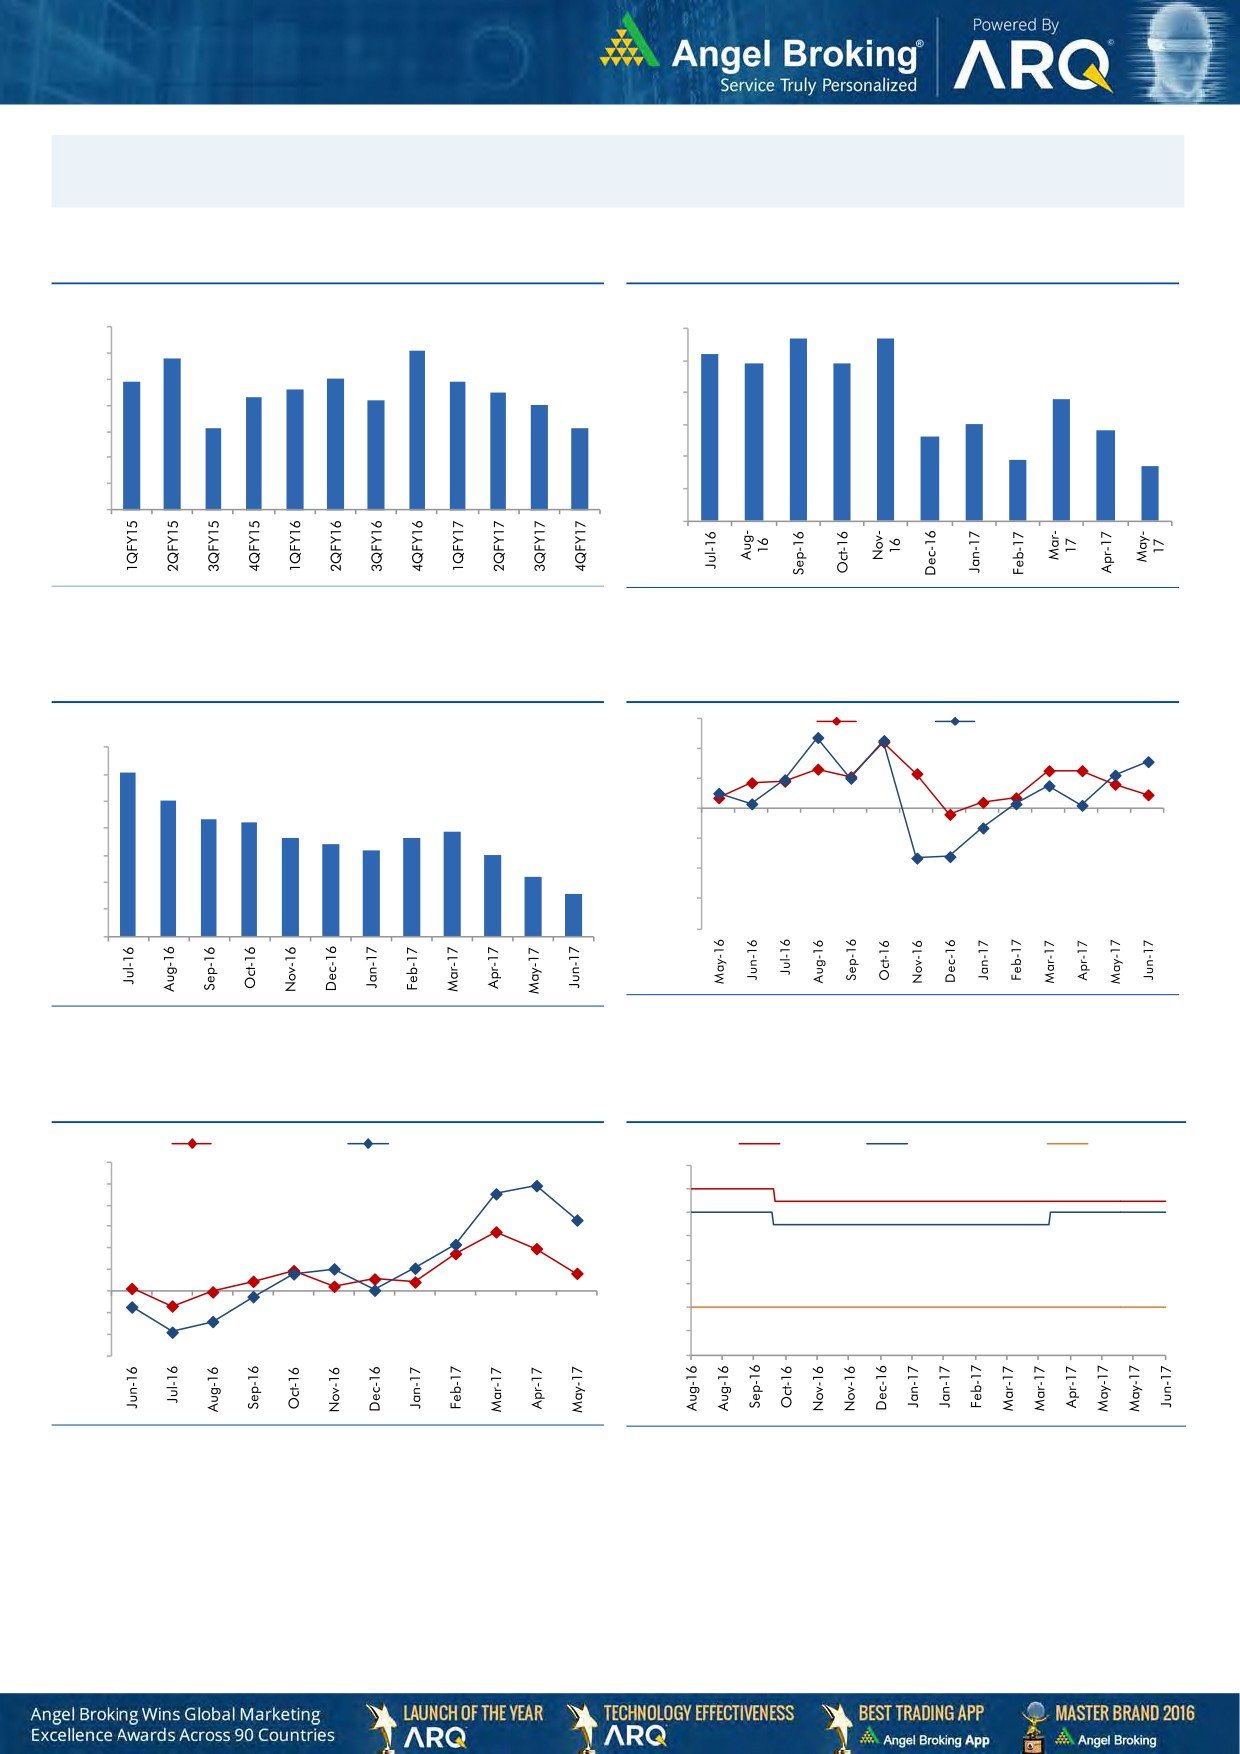
Macro watch
Exhibit 1: Quarterly GDP trends
Exhibit 2: IIP trends
(%)
(%)
5.7
5.7
10.0
6.0
9.1
5.2
8.8
4.9
4.9
9.0
7.9
8.0
7.9
5.0
7.6
7.5
8.0
7.3
7.2
3.8
7.0
4.0
7.0
3.0
6.1
6.1
2.8
3.0
2.6
6.0
1.9
1.7
5.0
2.0
4.0
1.0
3.0
-
Source: CSO, Angel Research
Source: MOSPI, Angel Research
Exhibit 3: Monthly CPI inflation trends
Exhibit 4: Manufacturing and services PMI
56.0
Mfg. PMI
Services PMI
(%)
7.0
54.0
6.1
6.0
52.0
5.1
5.0
4.3
4.2
3.9
50.0
3.6
3.7
4.0
3.4
3.2
3.0
48.0
3.0
2.2
46.0
2.0
1.5
44.0
1.0
42.0
-
Source: Market, Angel Research; Note: Level above 50 indicates expansion
Source: MOSPI, Angel Research
Exhibit 5: Exports and imports growth trends
Exhibit 6: Key policy rates
(%)
Exports yoy growth
Imports yoy growth
(%)
Repo rate
Reverse Repo rate
CRR
60.0
7.00
50.0
6.50
40.0
6.00
30.0
5.50
20.0
5.00
10.0
4.50
0.0
4.00
(10.0)
(20.0)
3.50
(30.0)
3.00
Source: Bloomberg, Angel Research
Source: RBI, Angel Research
Market Outlook
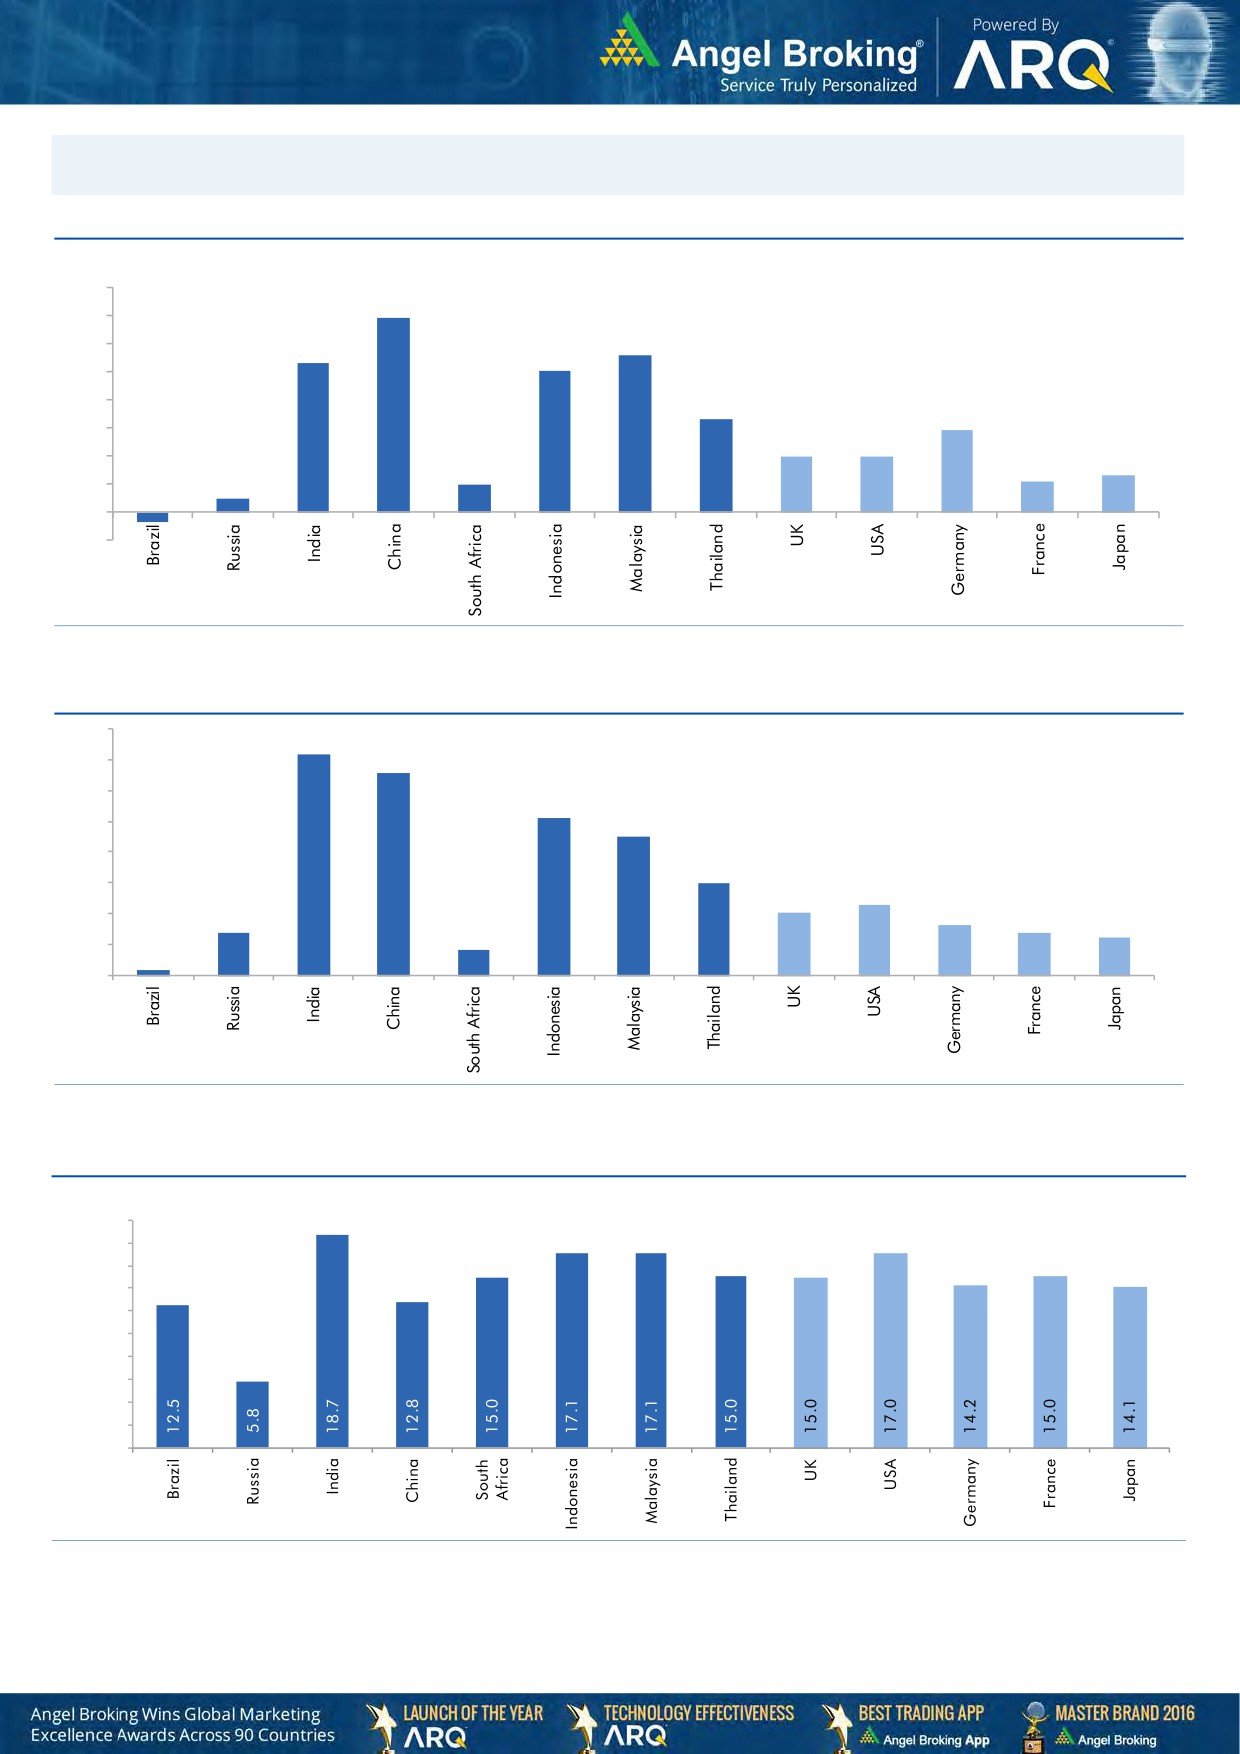
July 14, 2017
Global watch
Exhibit 1: Latest quarterly GDP Growth (%, yoy) across select developing and developed countries
(%)
8.0
6.9
7.0
5.6
6.0
5.3
5.0
1.0
5.0
4.0
3.3
2.9
3.0
2.0
2.0
0.5
2.0
1.1
1.3
1.0
-
(1.0)
(0.4)
Source: Bloomberg, Angel Research
Exhibit 2: 2016 GDP Growth projection by IMF (%, yoy) across select developing and developed countries
(%)
7.2
7.0
6.6
6.0
5.1
5.0
4.5
4.0
3.0
3.0
2.3
2.0
1.4
1.6
2.0
1.4
1.2
0.2
0.8
1.0
-
Source: IMF, Angel Research
Exhibit 3: One year forward P-E ratio across select developing and developed countries
(x)
20.0
18.0
16.0
14.0
12.0
10.0
8.0
6.0
4.0
2.0
-
Source: IMF, Angel Research
Market Outlook
July 14, 2017
Exhibit 4: Relative performance of indices across globe
Returns (%)
Country
Name of index
Closing price
1M
3M
1YR
Brazil
Bovespa
64,836
4.2
0.4
22.0
Russia
Micex
1,954
5.0
(0.8)
0.7
India
Nifty
9,816
2.9
7.1
18.8
China
Shanghai Composite
3,198
2.0
(2.2)
9.7
South Africa
Top 40
46,674
3.8
1.7
2.6
Mexico
Mexbol
50,810
3.4
2.6
9.8
Indonesia
LQ45
976
1.5
6.4
17.0
Malaysia
KLCI
1,757
(1.6)
1.0
6.7
Thailand
SET 50
996
1.5
(0.4)
9.4
USA
Dow Jones
21,532
1.2
4.2
17.2
UK
FTSE
7,417
(1.3)
0.9
11.5
Japan
Nikkei
20,098
1.0
6.9
28.3
Germany
DAX
12,627
(1.0)
3.6
26.7
France
CAC
5,222
(0.1)
3.0
20.1
Source: Bloomberg, Angel Research, #Data as on 12th July
Stock Watch
July 14, 2017
Company Name
Reco
CMP
Target
Mkt Cap
Sales ( Čcr )
OPM(%)
EPS (Č)
PER(x)
P/BV(x)
RoE(%)
EV/Sales(x)
(Č)
Price ( Č)
( Č cr )
FY17E FY18E
FY17E
FY18E
FY17E
FY18E
FY17E
FY18E
FY17E
FY18E
FY17E
FY18E
FY17E
FY18E
Agri / Agri Chemical
Rallis
Sell
249
209
4,835
1,937
2,164
13.3
14.3
9.0
11.0
27.6
22.6
4.8
4.2
18.4
19.8
2.5
2.2
United Phosphorus
Neutral
865
-
43,960
15,176
17,604
18.5
18.5
37.4
44.6
23.1
19.4
4.5
3.8
21.4
21.2
3.0
2.5
Auto & Auto Ancillary
Ashok Leyland
Accumulate
106
116
31,051
20,019
22,789
11.1
11.7
4.3
5.5
24.7
19.4
4.8
4.3
19.4
22.0
1.5
1.3
Bajaj Auto
Neutral
2,791
-
80,748
25,093
27,891
19.5
19.2
143.9
162.5
19.4
17.2
5.4
4.7
30.3
29.4
2.9
2.6
Bharat Forge
Neutral
1,120
-
26,079
7,726
8,713
20.5
21.2
35.3
42.7
31.7
26.2
5.9
5.3
18.9
20.1
3.4
3.0
Eicher Motors
Neutral
28,056
-
76,374
16,583
20,447
17.5
18.0
598.0
745.2
46.9
37.7
16.0
12.2
41.2
38.3
4.4
3.5
Gabriel India
Neutral
149
-
2,142
1,544
1,715
9.0
9.3
5.4
6.3
27.6
23.7
5.2
4.6
18.9
19.5
1.3
1.2
Hero Motocorp
Neutral
3,750
-
74,880
28,120
30,753
15.2
15.6
169.1
189.2
22.2
19.8
7.6
6.4
30.8
28.2
2.5
2.2
Jamna Auto Industries Neutral
263
-
2,093
1,486
1,620
9.8
9.9
15.0
17.2
17.5
15.3
3.8
3.2
21.8
21.3
1.5
1.3
L G Balakrishnan & Bros Neutral
784
-
1,231
1,302
1,432
11.6
11.9
43.7
53.0
18.0
14.8
2.5
2.3
13.8
14.2
1.0
0.9
Mahindra and Mahindra Neutral
1,371
-
85,133
46,534
53,077
11.6
11.7
67.3
78.1
20.4
17.6
3.3
2.9
15.4
15.8
1.8
1.5
Maruti
Accumulate
7,566
8,495
228,561
67,822
83,717
15.2
15.0
243.0
291.5
31.1
26.0
7.1
5.8
22.9
22.4
3.0
2.4
Minda Industries
Neutral
686
-
5,930
2,728
3,042
9.0
9.1
68.2
86.2
10.1
8.0
2.3
1.8
23.8
24.3
2.2
2.0
Motherson Sumi
Neutral
321
-
67,574
45,896
53,687
7.8
8.3
13.0
16.1
24.6
19.9
7.9
6.3
34.7
35.4
1.5
1.3
Rane Brake Lining
Neutral
1,332
-
1,054
511
562
11.3
11.5
28.1
30.9
47.4
43.1
7.2
6.6
15.3
15.0
2.2
2.0
Setco Automotive
Neutral
44
-
585
741
837
13.0
13.0
15.2
17.0
2.9
2.6
0.5
0.4
15.8
16.3
1.2
1.1
Tata Motors
Neutral
458
-
132,356
300,209
338,549
8.9
8.4
42.7
54.3
10.7
8.5
1.7
1.5
15.6
17.2
0.6
0.5
TVS Motor
Neutral
572
-
27,151
13,390
15,948
6.9
7.1
12.8
16.5
44.8
34.5
11.1
8.8
26.3
27.2
2.1
1.7
Amara Raja Batteries
Accumulate
852
962
14,546
5,339
6,220
15.9
15.3
28.0
32.3
30.4
26.4
5.8
4.9
19.1
18.5
2.7
2.3
Exide Industries
Neutral
227
-
19,270
7,439
8,307
15.0
15.0
8.1
9.3
28.0
24.4
3.9
3.5
14.3
16.7
2.2
2.0
Apollo Tyres
Neutral
252
-
12,810
12,877
14,504
14.3
13.9
21.4
23.0
11.7
10.9
1.8
1.6
16.4
15.2
1.2
1.1
Ceat
Neutral
1,880
-
7,606
7,524
8,624
13.0
12.7
131.1
144.3
14.3
13.0
2.6
2.2
19.8
18.6
1.1
1.0
JK Tyres
Neutral
169
-
3,839
7,455
8,056
15.0
15.0
21.8
24.5
7.8
6.9
1.6
1.3
22.8
21.3
0.6
0.6
Swaraj Engines
Neutral
2,154
-
2,676
660
810
15.2
16.4
54.5
72.8
39.5
29.6
12.3
11.2
31.5
39.2
3.9
3.1
Subros
Neutral
252
-
1,512
1,488
1,681
11.7
11.9
6.4
7.2
39.4
35.2
4.2
3.8
10.8
11.4
1.3
1.1
Indag Rubber
Neutral
206
-
541
286
326
19.8
16.8
11.7
13.3
17.6
15.5
3.0
2.8
17.8
17.1
1.6
1.4
Capital Goods
ACE
Neutral
72
-
709
709
814
4.1
4.6
1.4
2.1
51.2
34.1
2.1
2.0
4.4
6.0
1.2
1.0
BEML
Neutral
1,561
-
6,499
3,451
4,055
6.3
9.2
31.4
57.9
49.7
27.0
3.0
2.7
6.3
10.9
2.0
1.7
Bharat Electronics
Neutral
173
-
38,664
8,137
9,169
16.8
17.2
58.7
62.5
3.0
2.8
0.5
0.4
44.6
46.3
3.7
3.3
Stock Watch
July 14, 2017
Company Name
Reco
CMP
Target
Mkt Cap
Sales ( Čcr )
OPM(%)
EPS (Č)
PER(x)
P/BV(x)
RoE(%)
EV/Sales(x)
(Č)
Price ( Č)
( Č cr )
FY17E
FY18E
FY17E
FY18E
FY17E
FY18E
FY17E
FY18E
FY17E
FY18E
FY17E
FY18E
FY17E
FY18E
Capital Goods
Voltas
Neutral
485
-
16,040
6,511
7,514
7.9
8.7
12.9
16.3
37.6
29.7
6.8
5.9
16.7
18.5
2.2
1.9
BGR Energy
Neutral
154
-
1,108
16,567
33,848
6.0
5.6
7.8
5.9
19.7
26.0
1.1
1.1
4.7
4.2
0.2
0.1
BHEL
Neutral
142
-
34,829
28,797
34,742
-
2.8
2.3
6.9
61.9
20.6
1.1
1.0
1.3
4.8
0.9
0.6
Blue Star
Buy
640
760
6,123
4,283
5,077
5.9
7.3
14.9
22.1
43.0
28.9
8.4
7.0
20.4
26.4
1.5
1.2
CG Power and Industrial
Neutral
85
-
5,305
5,777
6,120
5.9
7.0
3.3
4.5
25.7
18.8
1.1
1.1
4.4
5.9
0.9
0.7
Solutions
Greaves Cotton
Neutral
160
-
3,902
1,755
1,881
16.8
16.9
7.8
8.5
20.5
18.8
4.1
3.8
20.6
20.9
1.9
1.7
Inox Wind
Neutral
165
-
3,672
5,605
6,267
15.7
16.4
24.8
30.0
6.7
5.5
1.9
1.4
25.9
24.4
0.7
0.6
KEC International
Neutral
295
-
7,588
9,294
10,186
7.9
8.1
9.9
11.9
29.8
24.8
4.4
3.8
15.6
16.3
1.1
1.0
KEI Industries
Accumulate
237
258
1,843
2,633
3,001
10.4
10.0
12.7
13.0
18.6
18.2
4.0
3.3
21.4
18.2
0.9
0.8
Thermax
Neutral
915
-
10,905
5,421
5,940
7.3
7.3
25.7
30.2
35.6
30.3
4.3
3.9
12.2
13.1
1.9
1.7
VATech Wabag
Neutral
685
-
3,736
3,136
3,845
8.9
9.1
26.0
35.9
26.3
19.1
3.3
2.8
13.4
15.9
1.1
0.9
Cement
ACC
Neutral
1,702
-
31,970
11,225
13,172
13.2
16.9
44.5
75.5
38.3
22.6
3.6
3.3
11.2
14.2
2.9
2.4
Ambuja Cements
Neutral
263
-
52,193
9,350
10,979
18.2
22.5
5.8
9.5
45.3
27.7
3.8
3.4
10.2
12.5
5.6
4.8
India Cements
Neutral
210
-
6,482
4,364
4,997
18.5
19.2
7.9
11.3
26.6
18.6
1.9
1.9
8.0
8.5
2.2
2.0
JK Cement
Neutral
973
-
6,801
4,398
5,173
15.5
17.5
31.2
55.5
31.2
17.5
3.7
3.2
12.0
15.5
2.1
1.7
J K Lakshmi Cement
Neutral
469
-
5,524
2,913
3,412
14.5
19.5
7.5
22.5
62.6
20.9
3.9
3.2
12.5
18.0
2.5
2.1
Orient Cement
Neutral
157
-
3,216
2,114
2,558
18.5
20.5
8.1
11.3
19.4
13.9
2.9
2.4
9.0
14.0
2.1
1.7
UltraTech Cement
Neutral
4,199
-
115,262
25,768
30,385
21.0
23.5
111.0
160.0
37.8
26.2
4.8
4.2
13.5
15.8
4.6
3.8
Construction
ITNL
Neutral
99
-
3,253
8,946
10,017
31.0
31.6
8.1
9.1
12.2
10.9
0.5
0.5
4.2
5.0
3.7
3.4
KNR Constructions
Neutral
220
-
3,098
1,385
1,673
14.7
14.0
41.2
48.5
5.4
4.5
1.0
0.9
14.9
15.2
2.3
1.9
Larsen & Toubro
Buy
1,175
1,700
164,543
111,017
124,908
11.0
11.0
61.1
66.7
19.2
17.6
2.3
2.1
13.1
12.9
2.5
2.3
Gujarat Pipavav Port
Neutral
145
-
6,998
705
788
52.2
51.7
5.0
5.6
29.0
25.9
2.9
2.6
11.2
11.2
9.6
8.1
Nagarjuna Const.
Neutral
95
-
5,276
8,842
9,775
9.1
8.8
5.3
6.4
17.9
14.8
1.4
1.3
8.2
9.1
0.8
0.7
PNC Infratech
Neutral
149
-
3,830
2,350
2,904
13.1
13.2
9.0
8.8
16.6
17.0
0.6
0.5
15.9
13.9
1.7
1.4
Simplex Infra
Neutral
541
-
2,674
6,829
7,954
10.5
10.5
31.4
37.4
17.2
14.5
1.8
1.6
9.9
13.4
0.8
0.7
Power Mech Projects
Neutral
592
-
870
1,801
2,219
12.7
14.6
72.1
113.9
8.2
5.2
1.5
1.3
16.8
11.9
0.5
0.4
Sadbhav Engineering
Neutral
293
-
5,028
3,598
4,140
10.3
10.6
9.0
11.9
32.6
24.6
3.4
3.0
9.9
11.9
1.7
1.4
NBCC
Neutral
212
-
19,121
7,428
9,549
7.9
8.6
8.2
11.0
25.9
19.3
1.3
1.0
28.2
28.7
2.3
1.7
MEP Infra
Neutral
131
-
2,128
1,877
1,943
30.6
29.8
3.0
4.2
43.6
31.2
21.1
14.2
0.6
0.6
2.5
2.3
Stock Watch
July 14, 2017
Company Name
Reco
CMP
Target
Mkt Cap
Sales ( Čcr )
OPM(%)
EPS (Č)
PER(x)
P/BV(x)
RoE(%)
EV/Sales(x)
(Č)
Price ( Č)
( Č cr )
FY17E
FY18E
FY17E
FY18E
FY17E
FY18E
FY17E
FY18E
FY17E
FY18E
FY17E
FY18E
FY17E
FY18E
Construction
SIPL
Neutral
106
-
3,737
1,036
1,252
65.5
66.2
(8.4)
(5.6)
4.0
4.5
(22.8)
(15.9)
11.8
9.8
Engineers India
Neutral
157
-
10,570
1,725
1,935
16.0
19.1
11.4
13.9
13.8
11.3
1.9
1.8
13.4
15.3
5.1
4.5
Financials
Axis Bank
Accumulate
512
580
122,735
46,932
53,575
3.5
3.4
32.4
44.6
15.8
11.5
2.0
1.8
13.6
16.5
-
-
Bank of Baroda
Neutral
163
-
37,569
19,980
23,178
1.8
1.8
11.5
17.3
14.2
9.4
1.6
1.3
8.3
10.1
-
-
Canara Bank
Neutral
362
-
21,610
15,225
16,836
1.8
1.8
14.5
28.0
25.0
12.9
1.7
1.4
5.8
8.5
-
-
Can Fin Homes
Neutral
3,206
-
8,534
420
526
3.5
3.5
86.5
107.8
37.1
29.7
8.0
6.5
23.6
24.1
-
-
Cholamandalam Inv. &
Accumulate
1,167
1,230
18,233
2,012
2,317
6.3
6.3
42.7
53.6
27.3
21.8
4.3
3.7
16.9
18.3
-
-
Fin. Co.
Dewan Housing Finance Buy
443
520
13,890
2,225
2,688
2.9
2.9
29.7
34.6
14.9
12.8
2.4
1.6
16.1
14.8
-
-
Equitas Holdings
Buy
170
235
5,759
939
1,281
11.7
11.5
5.8
8.2
29.4
20.8
2.5
2.3
10.9
11.5
-
-
Federal Bank
Accumulate
115
125
22,374
8,259
8,995
3.0
3.0
4.3
5.6
26.8
20.6
2.3
2.1
8.5
10.1
-
-
HDFC
Neutral
1,656
-
263,831
11,475
13,450
3.4
3.4
45.3
52.5
36.6
31.6
7.1
6.2
20.2
20.5
-
-
HDFC Bank
Neutral
1,681
-
432,721
46,097
55,433
4.5
4.5
58.4
68.0
28.8
24.7
5.1
4.2
18.8
18.6
-
-
ICICI Bank
Accumulate
298
315
190,942
42,800
44,686
3.1
3.3
18.0
21.9
16.5
13.6
2.2
2.1
11.1
12.3
-
-
Karur Vysya Bank
Accumulate
141
160
8,527
5,640
6,030
3.3
3.2
8.9
10.0
15.9
14.1
1.7
1.6
11.2
11.4
-
-
Lakshmi Vilas Bank
Neutral
203
-
3,884
3,339
3,799
2.7
2.8
11.0
14.0
18.4
14.5
1.9
1.8
11.2
12.7
-
-
LIC Housing Finance
Neutral
739
-
37,292
3,712
4,293
2.6
2.5
39.0
46.0
19.0
16.1
3.6
3.0
19.9
20.1
-
-
Punjab Natl.Bank
Neutral
152
-
32,377
23,532
23,595
2.3
2.4
6.8
12.6
22.4
12.1
3.5
2.5
3.3
6.5
-
-
RBL Bank
Neutral
546
-
20,577
1,783
2,309
2.6
2.6
12.7
16.4
43.0
33.3
4.7
4.2
12.8
13.3
-
-
Repco Home Finance
Neutral
797
-
4,989
388
457
4.5
4.2
30.0
38.0
26.6
21.0
4.4
3.7
18.0
19.2
-
-
South Ind.Bank
Neutral
28
-
5,122
6,435
7,578
2.5
2.5
2.7
3.1
10.5
9.2
1.4
1.1
10.1
11.2
-
-
St Bk of India
Neutral
289
-
249,121
88,650
98,335
2.6
2.6
13.5
18.8
21.4
15.4
2.0
1.8
7.0
8.5
-
-
Union Bank
Neutral
155
-
10,638
13,450
14,925
2.3
2.3
25.5
34.5
6.1
4.5
0.9
0.8
7.5
10.2
-
-
Yes Bank
Neutral
1,582
-
72,361
8,978
11,281
3.3
3.4
74.0
90.0
21.4
17.6
4.1
3.4
17.0
17.2
-
-
FMCG
Akzo Nobel India
Neutral
1,803
-
8,647
2,955
3,309
13.3
13.7
57.2
69.3
31.6
26.0
10.3
8.7
32.7
33.3
2.7
2.4
Asian Paints
Neutral
1,124
-
107,828
17,128
18,978
16.8
16.4
19.1
20.7
58.9
54.3
20.5
19.3
34.8
35.5
6.2
5.6
Britannia
Neutral
3,722
-
44,684
9,594
11,011
14.6
14.9
80.3
94.0
46.4
39.6
19.1
14.7
41.2
-
4.5
3.9
Colgate
Neutral
1,074
-
29,211
4,605
5,149
23.4
23.4
23.8
26.9
45.1
39.9
25.0
19.5
64.8
66.8
6.3
5.6
Dabur India
Neutral
302
-
53,216
8,315
9,405
19.8
20.7
8.1
9.2
37.3
32.8
10.4
8.6
31.6
31.0
6.1
5.3
GlaxoSmith Con*
Neutral
5,491
-
23,092
4,350
4,823
21.2
21.4
179.2
196.5
30.6
28.0
8.1
6.9
27.1
26.8
4.7
4.2
Stock Watch
July 14, 2017
Company Name
Reco
CMP
Target
Mkt Cap
Sales ( Čcr )
OPM(%)
EPS (Č)
PER(x)
P/BV(x)
RoE(%)
EV/Sales(x)
(Č)
Price ( Č)
( Č cr )
FY17E FY18E
FY17E
FY18E
FY17E
FY18E
FY17E
FY18E
FY17E
FY18E
FY17E
FY18E
FY17E
FY18E
FMCG
Godrej Consumer
Neutral
982
-
66,870
10,235
11,428
18.4
18.6
41.1
44.2
23.9
22.2
5.3
4.5
24.9
24.8
6.6
5.9
HUL
Neutral
1,133
-
245,277
35,252
38,495
17.8
17.8
20.7
22.4
54.9
50.6
52.5
45.0
95.6
88.9
6.8
6.2
ITC
Neutral
339
-
411,533
40,059
44,439
38.3
39.2
9.0
10.1
37.7
33.4
10.5
9.2
27.8
27.5
9.8
8.8
Marico
Neutral
327
-
42,218
6,430
7,349
18.8
19.5
6.4
7.7
51.1
42.5
15.4
13.0
33.2
32.5
6.4
5.5
Nestle*
Neutral
6,785
-
65,416
10,073
11,807
20.7
21.5
124.8
154.2
54.4
44.0
22.3
20.1
34.8
36.7
6.3
5.4
Tata Global
Neutral
175
-
11,070
8,675
9,088
9.8
9.8
7.4
8.2
23.7
21.4
1.9
1.8
7.9
8.1
1.2
1.1
Procter & Gamble
Neutral
8,011
-
26,003
2,939
3,342
23.2
23.0
146.2
163.7
54.8
48.9
13.9
11.5
25.3
23.5
8.4
7.3
Hygiene
IT
HCL Tech^
Buy
858
1,014
122,421
46,723
52,342
22.1
20.9
60.0
62.8
14.3
13.7
3.6
3.1
25.3
22.4
2.4
2.0
Infosys
Buy
976
1,179
224,251
68,484
73,963
26.0
26.0
63.0
64.0
15.5
15.3
3.3
3.0
20.8
19.7
2.9
2.6
TCS
Accumulate
2,444
2,651
481,582
117,966
127,403
27.5
27.6
134.3
144.5
18.2
16.9
5.4
5.0
29.8
29.7
3.7
3.5
Tech Mahindra
Buy
389
533
37,955
29,141
31,051
14.4
15.0
32.3
35.6
12.1
10.9
2.1
1.9
17.1
17.0
1.2
1.0
Wipro
Accumulate
264
280
128,564
55,421
58,536
20.3
20.3
35.1
36.5
7.5
7.2
1.3
1.1
19.2
14.6
1.7
1.5
Media
D B Corp
Neutral
379
-
6,964
2,297
2,590
27.4
28.2
21.0
23.4
18.0
16.2
4.2
3.6
23.7
23.1
2.8
2.4
HT Media
Neutral
84
-
1,943
2,693
2,991
12.6
12.9
7.9
9.0
10.6
9.3
0.9
0.8
7.8
8.3
0.3
0.2
Jagran Prakashan
Buy
178
225
5,811
2,283
2,555
28.0
28.0
10.6
12.3
16.7
14.5
3.6
3.1
21.4
21.4
2.6
2.2
Sun TV Network
Neutral
829
-
32,679
2,850
3,265
70.1
71.0
26.2
30.4
31.7
27.3
8.1
7.2
24.3
25.6
11.1
9.5
Hindustan Media
Neutral
279
-
2,045
1,016
1,138
24.3
25.2
27.3
30.1
10.2
9.3
1.9
1.7
16.2
15.8
1.3
1.2
Ventures
TV Today Network
Buy
248
344
1,479
608
667
21.5
22.3
15.7
19.2
15.8
12.9
2.4
2.1
16.1
16.0
2.0
1.7
Metals & Mining
Coal India
Neutral
253
-
157,327
84,638
94,297
21.4
22.3
24.5
27.1
10.3
9.4
4.3
4.1
42.6
46.0
1.4
1.2
Hind. Zinc
Neutral
277
-
116,851
14,252
18,465
55.9
48.3
15.8
21.5
17.5
12.9
2.9
2.5
17.0
20.7
8.2
6.3
Hindalco
Neutral
205
-
45,890
107,899
112,095
7.4
8.2
9.2
13.0
22.2
15.7
1.1
1.0
4.8
6.6
1.0
0.9
JSW Steel
Neutral
213
-
51,584
53,201
58,779
16.1
16.2
130.6
153.7
1.6
1.4
0.2
0.2
14.0
14.4
1.7
1.5
NMDC
Neutral
120
-
37,872
6,643
7,284
44.4
47.7
7.1
7.7
16.9
15.6
1.5
1.4
8.8
9.2
3.5
3.1
SAIL
Neutral
62
-
25,503
47,528
53,738
(0.7)
2.1
(1.9)
2.6
23.8
0.7
0.6
(1.6)
3.9
1.4
1.3
Vedanta
Neutral
263
-
97,781
71,744
81,944
19.2
21.7
13.4
20.1
19.6
13.1
1.7
1.5
8.4
11.3
1.8
1.4
Tata Steel
Neutral
563
-
54,679
121,374
121,856
7.2
8.4
18.6
34.3
30.3
16.4
1.9
1.7
6.1
10.1
1.1
1.1
Oil & Gas
GAIL
Neutral
371
-
62,807
56,220
65,198
9.3
10.1
27.1
33.3
13.7
11.2
1.3
1.2
9.3
10.7
1.3
1.1
ONGC
Neutral
159
-
204,177
137,222
152,563
15.0
21.8
19.5
24.1
8.2
6.6
0.7
0.7
8.5
10.1
1.8
1.6
Indian Oil Corp
Neutral
381
-
184,986
373,359
428,656
5.9
5.5
54.0
59.3
7.1
6.4
1.1
1.0
16.0
15.6
0.6
0.6
Stock Watch
July 14, 2017
Company Name
Reco
CMP
Target
Mkt Cap
Sales ( Čcr )
OPM(%)
EPS (Č)
PER(x)
P/BV(x)
RoE(%)
EV/Sales(x)
(Č)
Price ( Č)
( Č cr )
FY17E FY18E
FY17E
FY18E
FY17E
FY18E
FY17E
FY18E
FY17E
FY18E
FY17E
FY18E
FY17E
FY18E
Oil & Gas
Reliance Industries
Neutral
1,519
-
493,864
301,963
358,039
12.1
12.6
87.7
101.7
17.3
14.9
1.8
1.6
10.7
11.3
2.1
1.8
Pharmaceuticals
Alembic Pharma
Buy
538
648
10,151
3,101
3,966
19.7
20.5
21.4
25.5
25.2
21.1
5.3
4.4
23.0
22.8
3.2
2.4
Alkem Laboratories Ltd
Buy
1,807
2,161
21,609
5,853
6,901
17.1
18.4
74.6
85.0
24.2
21.3
5.1
4.3
21.1
20.2
3.7
3.1
Aurobindo Pharma
Buy
705
823
41,278
14,845
17,086
21.5
22.1
39.4
44.7
17.9
15.8
4.4
3.5
27.6
24.7
2.9
2.5
Aventis*
Neutral
4,181
-
9,628
2,206
2,508
16.6
16.8
128.9
139.9
32.4
29.9
5.5
4.3
21.6
23.5
4.1
3.5
Cadila Healthcare
Reduce
519
450
53,091
9,220
11,584
18.4
20.3
14.5
18.7
35.8
27.7
7.6
6.2
23.5
24.6
6.1
4.6
Cipla
Reduce
542
461
43,619
14,281
16,619
15.4
16.2
12.5
19.7
43.4
27.5
3.5
3.1
8.4
12.0
3.2
2.7
Dr Reddy's
Neutral
2,693
-
44,642
14,081
15,937
16.1
18.6
72.6
105.9
37.1
25.4
3.6
3.3
9.6
13.6
3.4
3.0
Dishman Pharma
Sell
143
1,718
1,890
22.7
22.8
9.5
11.3
10.1
10.9
3.3
2.9
GSK Pharma*
Neutral
2,583
-
21,878
2,927
3,290
11.8
16.2
34.4
49.6
75.1
52.1
10.9
11.3
13.9
21.3
7.3
6.5
Indoco Remedies
Sell
200
153
1,845
1,067
1,154
12.1
14.9
8.4
11.3
23.8
17.7
2.8
2.5
12.6
15.0
1.9
1.8
Ipca labs
Buy
480
620
6,058
3,211
3,593
13.9
14.5
15.4
19.4
31.2
24.8
2.5
2.3
8.2
9.5
2.0
1.8
Lupin
Buy
1,142
1,526
51,582
17,120
18,657
24.1
24.1
56.9
61.1
20.1
18.7
3.8
3.2
20.7
18.6
3.3
2.7
Natco Pharma
Accumulate
989
1,060
17,244
2,065
1,988
33.1
33.7
27.9
25.7
35.5
38.5
10.3
8.8
29.2
22.9
8.4
8.5
Sun Pharma
Buy
569
712
136,601
30,264
32,899
29.0
26.9
32.7
31.6
17.4
18.0
3.7
3.2
22.2
18.7
4.2
3.8
Power
Tata Power
Neutral
83
-
22,517
36,916
39,557
17.4
27.1
5.1
6.3
16.3
13.2
1.4
1.3
9.0
10.3
1.6
1.5
NTPC
Neutral
164
-
135,019
86,605
95,545
17.5
20.8
11.8
13.4
13.9
12.2
1.4
1.3
10.5
11.1
2.9
2.9
Power Grid
Neutral
215
-
112,531
25,315
29,193
88.2
88.7
14.2
17.2
15.2
12.5
2.3
2.0
15.2
16.1
9.1
8.2
Real Estate
Prestige Estate
Neutral
274
-
10,283
4,707
5,105
25.2
26.0
10.3
13.0
26.6
21.1
2.1
2.0
10.3
10.2
3.4
3.0
MLIFE
Buy
446
522
2,290
1,152
1,300
22.7
24.6
29.9
35.8
14.9
12.5
1.1
1.0
7.6
8.6
2.7
2.3
Telecom
Bharti Airtel
Neutral
403
-
161,075
105,086
114,808
34.5
34.7
12.2
16.4
33.0
24.6
2.2
2.1
6.8
8.4
2.4
2.1
Idea Cellular
Neutral
88
-
31,589
40,133
43,731
37.2
37.1
6.4
6.5
13.7
13.5
1.1
1.1
8.2
7.6
1.8
1.5
zOthers
Abbott India
Neutral
4,401
-
9,352
3,153
3,583
14.1
14.4
152.2
182.7
28.9
24.1
142.0
121.3
25.6
26.1
2.7
2.3
Asian Granito
Accumulate
447
480
1,345
1,066
1,169
11.6
12.5
13.0
16.0
34.4
28.0
3.4
3.0
9.5
10.7
1.6
1.4
Bajaj Electricals
Buy
331
395
3,361
4,801
5,351
5.7
6.2
10.4
13.7
31.8
24.2
3.9
3.5
12.4
14.5
0.7
0.6
Banco Products (India)
Neutral
230
-
1,646
1,353
1,471
12.3
12.4
14.5
16.3
15.9
14.1
21.9
19.7
14.5
14.6
1.2
124.4
Coffee Day Enterprises
Neutral
248
-
5,109
2,964
3,260
20.5
21.2
4.7
8.0
-
31.0
2.9
2.6
5.5
8.5
2.1
1.9
Ltd
Competent Automobiles Neutral
189
-
121
1,137
1,256
3.1
2.7
28.0
23.6
6.7
8.0
36.3
32.8
14.3
11.5
0.1
0.1
Elecon Engineering
Neutral
64
-
716
1,482
1,660
13.7
14.5
3.9
5.8
16.4
11.0
3.9
3.5
7.8
10.9
0.8
0.7
Stock Watch
July 14, 2017
Company Name
Reco
CMP
Target
Mkt Cap
Sales ( Čcr )
OPM(%)
EPS (Č)
PER(x)
P/BV(x)
RoE(%)
EV/Sales(x)
(Č)
Price ( Č)
( Č cr )
FY17E
FY18E
FY17E
FY18E
FY17E
FY18E
FY17E
FY18E
FY17E
FY18E
FY17E
FY18E
FY17E
FY18E
zOthers
Finolex Cables
Neutral
510
-
7,798
2,883
3,115
12.0
12.1
14.2
18.6
35.9
27.4
19.1
16.7
15.8
14.6
2.4
2.2
Garware Wall Ropes
Neutral
953
-
2,084
863
928
15.1
15.2
36.4
39.4
26.2
24.2
4.7
4.0
17.5
15.9
2.3
2.1
Goodyear India*
Neutral
927
-
2,139
1,598
1,704
10.4
10.2
49.4
52.6
18.8
17.6
86.7
76.0
18.2
17.0
1.0
146.7
Hitachi
Neutral
2,028
-
5,515
2,081
2,433
8.8
8.9
33.4
39.9
60.7
50.8
49.0
40.8
22.1
21.4
2.6
2.2
HSIL
Neutral
392
-
2,830
2,384
2,515
15.8
16.3
15.3
19.4
25.6
20.2
25.4
21.9
7.8
9.3
1.4
1.2
Interglobe Aviation
Neutral
1,276
-
46,138
21,122
26,005
14.5
27.6
110.7
132.1
11.5
9.7
69.0
49.3
168.5
201.1
2.2
1.7
Jyothy Laboratories
Neutral
367
-
6,674
1,440
2,052
11.5
13.0
8.5
10.0
43.2
36.7
10.5
9.7
18.6
19.3
4.9
3.4
Kirloskar Engines India
Neutral
395
-
5,710
2,554
2,800
9.9
10.0
10.5
12.1
37.6
32.6
15.7
14.8
10.7
11.7
1.9
1.7
Ltd
Linc Pen & Plastics
Neutral
288
-
425
382
420
9.3
9.5
13.5
15.7
21.4
18.3
3.7
3.2
17.1
17.3
1.2
1.1
M M Forgings
Neutral
671
-
809
546
608
20.4
20.7
41.3
48.7
16.3
13.8
91.9
81.3
16.6
17.0
1.3
1.2
Manpasand Bever.
Neutral
760
-
4,351
836
1,087
19.6
19.4
16.9
23.8
45.0
31.9
5.4
4.7
12.0
14.8
4.9
3.7
Mirza International
Neutral
157
-
1,886
963
1,069
17.2
18.0
6.1
7.5
25.6
20.9
3.9
3.3
15.0
15.7
2.2
1.9
MT Educare
Neutral
77
-
305
366
417
17.7
18.2
9.4
10.8
8.2
7.1
1.8
1.6
22.2
22.3
0.7
0.6
Narayana Hrudaya
Neutral
305
-
6,230
1,873
2,166
11.5
11.7
2.6
4.0
115.3
76.9
7.1
6.4
6.1
8.3
3.4
2.9
Navkar Corporation
Buy
206
265
2,938
347
371
43.2
37.3
6.7
6.0
30.9
34.4
2.1
1.9
6.2
10.6
9.6
9.0
Navneet Education
Neutral
178
-
4,156
1,062
1,147
24.0
24.0
6.1
6.6
29.2
26.9
6.0
5.3
20.6
19.8
4.0
3.7
Nilkamal
Neutral
1,980
-
2,955
1,995
2,165
10.7
10.4
69.8
80.6
28.4
24.6
113.1
98.3
16.6
16.5
1.5
1.3
Page Industries
Neutral
16,798
-
18,736
2,450
3,124
20.1
17.6
299.0
310.0
56.2
54.2
374.1
285.6
47.1
87.5
7.7
6.1
Parag Milk Foods
Neutral
239
-
2,009
1,919
2,231
9.3
9.6
9.5
12.9
25.3
18.5
3.9
3.2
15.5
17.5
1.2
1.0
Quick Heal
Neutral
228
-
1,597
408
495
27.3
27.0
7.7
8.8
29.4
25.9
2.7
2.7
9.3
10.6
3.1
2.5
Radico Khaitan
Accumulate
132
147
1,751
1,667
1,824
13.0
13.2
6.7
8.2
19.8
16.1
1.8
1.6
9.0
10.2
1.4
1.3
Relaxo Footwears
Neutral
513
-
6,167
2,085
2,469
9.2
8.2
7.6
8.0
67.9
64.6
26.3
22.5
17.9
18.8
3.0
2.6
S H Kelkar & Co.
Neutral
267
-
3,865
1,036
1,160
15.1
15.0
6.1
7.2
43.8
37.2
4.7
4.3
10.7
11.5
3.6
3.2
Siyaram Silk Mills
Neutral
2,428
-
2,276
1,574
1,769
12.5
12.7
97.1
113.1
25.0
21.5
3.8
3.3
15.4
15.5
1.7
1.5
Styrolution ABS India*
Neutral
921
-
1,619
1,440
1,537
9.2
9.0
40.6
42.6
22.7
21.6
57.9
52.6
12.3
11.6
1.1
1.0
Surya Roshni
Neutral
285
-
1,249
3,342
3,625
7.8
7.5
17.3
19.8
16.5
14.4
31.3
25.1
10.5
10.8
0.6
0.6
Team Lease Serv.
Neutral
1,481
-
2,531
3,229
4,001
1.5
1.8
22.8
32.8
65.0
45.1
7.0
6.0
10.7
13.4
0.7
0.5
The Byke Hospitality
Neutral
190
-
761
287
384
20.5
20.5
7.6
10.7
25.0
17.7
5.2
4.2
20.7
23.5
2.7
2.0
Transport Corporation of
Neutral
333
-
2,550
2,671
2,911
8.5
8.8
13.9
15.7
24.0
21.3
3.3
2.9
13.7
13.8
1.1
1.0
India
Stock Watch
July 14, 2017
Company Name
Reco
CMP
Target Mkt Cap
Sales ( Čcr )
OPM(%)
EPS (Č)
PER(x)
P/BV(x)
RoE(%)
EV/Sales(x)
(Č)
Price ( Č)
( Č cr )
FY17E FY18E FY17E FY18E FY17E FY18E FY17E FY18E FY17E FY18E FY17E FY18E FY17E FY18E
zOthers
TVS Srichakra
Neutral
3,788
-
2,900
2,304
2,614
13.7
13.8
231.1
266.6
16.4
14.2
425.6
335.1
33.9
29.3
1.3
1.1
UFO Moviez
Neutral
394
-
1,087
619
685
33.2
33.4
30.0
34.9
13.2
11.3
1.8
1.6
13.8
13.9
1.5
1.1
Visaka Industries
Neutral
531
-
843
1,051
1,138
10.3
10.4
21.0
23.1
25.3
22.9
68.1
63.7
9.0
9.2
1.1
1.0
VRL Logistics
Neutral
327
-
2,986
1,902
2,119
16.7
16.6
14.6
16.8
22.5
19.5
4.9
4.3
21.9
22.2
1.7
1.5
VIP Industries
Buy
187
218
2,642
1,270
1,450
10.4
10.4
5.6
6.5
33.4
28.8
6.9
6.0
20.7
21.1
2.1
1.8
Navin Fluorine
Accumulate
3,305
3,650
3,253
789
945
21.1
22.4
120.1
143.4
27.5
23.1
4.4
3.8
17.8
18.5
4.1
3.3
Source: Company, Angel Research; Note: *December year end; #September year end; &October year end; Price as on July 13, 2017
Market Outlook
July 14, 2017
Research Team Tel: 022 - 39357800
DISCLAIMER
Angel Broking Private Limited (hereinafter referred to as “Angel”) is a registered Member of National Stock Exchange of India
Limited,Bombay Stock Exchange Limited and Metropolitan Stock Exchange Limited. It is also registered as a Depository Participant with
CDSL and Portfolio Manager with SEBI. It also has registration with AMFI as a Mutual Fund Distributor. Angel Broking Private Limited is a
registered entity with SEBI for Research Analyst in terms of SEBI (Research Analyst) Regulations, 2014 vide registration number
INH000000164. Angel or its associates has not been debarred/ suspended by SEBI or any other regulatory authority for accessing
/dealing in securities Market. Angel or its associates/analyst has not received any compensation / managed or
co-managed public offering of securities of the company covered by Analyst during the past twelve months.
This document is solely for the personal information of the recipient, and must not be singularly used as the basis of any investment
decision. Nothing in this document should be construed as investment or financial advice. Each recipient of this document should make
such investigations as they deem necessary to arrive at an independent evaluation of an investment in the securities of the companies
referred to in this document (including the merits and risks involved), and should consult their own advisors to determine the merits and
risks of such an investment.
Reports based on technical and derivative analysis center on studying charts of a stock's price movement, outstanding positions and
trading volume, as opposed to focusing on a company's fundamentals and, as such, may not match with a report on a company's
fundamentals. Investors are advised to refer the Fundamental and Technical Research Reports available on our website to evaluate the
contrary view, if any.
The information in this document has been printed on the basis of publicly available information, internal data and other reliable
sources believed to be true, but we do not represent that it is accurate or complete and it should not be relied on as such, as this
document is for general guidance only. Angel Broking Pvt. Limited or any of its affiliates/ group companies shall not be in any way
responsible for any loss or damage that may arise to any person from any inadvertent error in the information contained in this report.
Angel Broking Pvt. Limited has not independently verified all the information contained within this document. Accordingly, we cannot
testify, nor make any representation or warranty, express or implied, to the accuracy, contents or data contained within this document.
While Angel Broking Pvt. Limited endeavors to update on a reasonable basis the information discussed in this material, there may be
regulatory, compliance, or other reasons that prevent us from doing so.
This document is being supplied to you solely for your information, and its contents, information or data may not be reproduced,
redistributed or passed on, directly or indirectly.
Neither Angel Broking Pvt. Limited, nor its directors, employees or affiliates shall be liable for any loss or damage that may arise from
or in connection with the use of this information.